Scheduler
The “Scheduler” section is the place that contains a list of all the scheduling jobs for dashboards and schemas loading (not business schemas), in addition to Data Alerts. To access the scheduler, select the “Scheduler” tab at the top of the screen. This page contains three tabs for “Dashboards”, “Schema Loads”, and “Data Alerts”, displaying a list of all the scheduled jobs for the chosen tab.
Schedule a Dashboard
Schedule dashboards to be sent to internal users, groups, or even external users with external email addresses either once or at scheduled intervals. For a list of suspended, active, and completed dashboards scheduled jobs, go to the Scheduler tab.
Dashboard schedules
Dashboards schedules can only be viewed or deleted in the “Scheduler” page. To view a list of all the scheduled jobs for dashboards:
- Select the “Scheduler” tab at the top of the screen.
- Select the drop-down menu in the upper right-hand corner of the “Jobs” table to toggle the view between “All”, “Active”, “Suspended”, and “Completed” dashboard schedule jobs. Note that jobs with no recurrence end date would not show in the “Completed” jobs list, until an end date has been set.
- Select anywhere (not the “Dashboard” name) on any job row to view the details for that job.
- Select the value for the “Dashboard” column to view that dashboard.
- If you would like to delete a dashboard scheduled job, select that job. The “Actions” menu appears in the upper right-hand corner.
- Select the “Actions” drop-down menu.
- Select “Delete selection”.
- Select Delete.
Schema schedules
The Incorta Unified Data Analytics Platform offers the option to schedule schemas to load automatically, replacing the previously known “Automatic Refresh”. Scheduled jobs for schemas can be created, viewed or deleted in the “Scheduler” page. To create a schema load schedule job, you can either schedule a schema load from the “Scheduler” page or schedule a schema load from the schema definition page.
View/delete schema load schedule jobs
- Select the “Scheduler” tab at the top of the screen. The “Scheduler” opens to the “Dashboards” tab by default.
- Select the “Schema Loads” tab to see the scheduled jobs for schema loads.
- Select the drop-down menu in the upper right-hand corner of the “Jobs” table to toggle the view between “All”, “Active”, “Suspended”, and “Completed” schema schedule jobs. Note that jobs with no recurrence end date would not show in the “Completed” jobs list until an end date has been set.
- Select anywhere (not the “Schema” column) on any job row to view the details for that job.
- Select the value for the “Schema” column to view the definition page for that schema.
- If you would like to delete a schema loading schedule job, select that job. The “Actions” menu appears in the upper right-hand corner.
-
Select the “Actions” drop-down menu.
- Select “Delete selection”. The deletion confirmation box appears.
- Select Delete.
Schedule a schema load from the “Scheduler” page
- Navigate to the “Scheduler” page for schemas, see View/delete schema load schedule jobs.
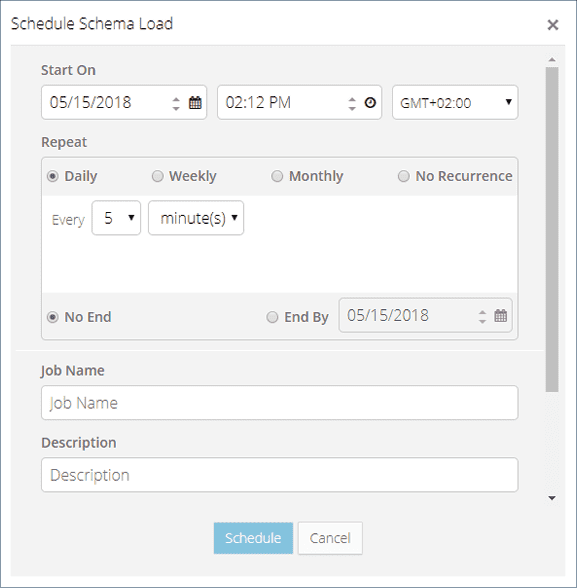
- Select ”+” in the upper right-hand corner of the screen. The scheduler window opens.

- Provide a job name and a description in the “Job Name” and “Description” fields, respectively.
- Select a schema to load.
- Select the type of loading from the drop-down list.
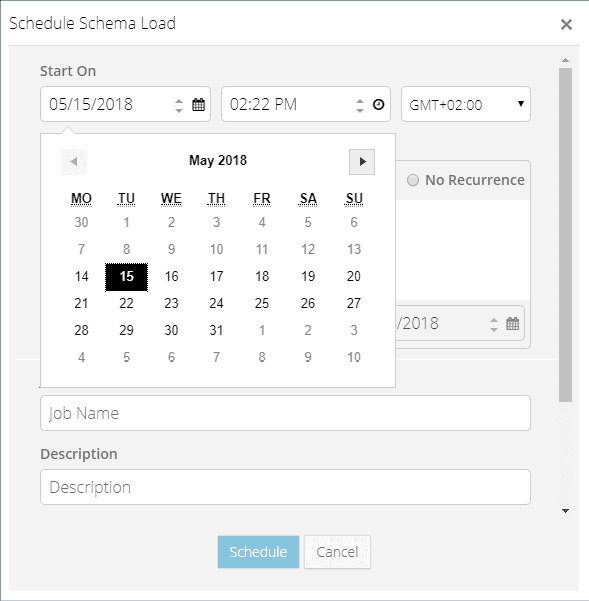
- Select a “Start on” date and time to schedule a schema to send. You can either type them in the respective fields or select them in the pop-up calendar (select the calendar icon) and clock (select the clock icon).

- Select a recurrence of the job to be, e.g. “Daily”.
- Select a job frequency in the “Every” field, e.g. 1, and choose a time unit, e.g. “hour(s)“.
- Select an end date (if any), in the “End By” field.
- Confirm all the entries and select Schedule.
After completing the previous steps, a scheduler job gets created and can be viewed/deleted in the “Scheduler” page.
Data Alerts
The Incorta Unified Data Analytics Platform supports Data Alerts. This feature tests a trigger on a scheduled basis and delivers an Insight using email to a list of recipients if the trigger condition is true. Triggers are based on a selected table and are true if the table has at least one row of data, and false if the table is empty. That is, to use this feature, the logged-in user would need to select a target dashboard that already exists, and creates a condition table Insight (containing a filter). If the condition table returns at least one row, the condition is true and the target dashboard will be sent to the recipients listed in the Alert editor. If the table is empty, the condition is then false, and thus no alerts will be sent.
To access the Data Alerts feature:
- Navigate to the Insight you want to configure for data alerts, or the Scheduler section of the Incorta Unified Data Analytics Platform. The Scheduler opens to the Dashboards tab by default.
- Select the Data Alerts tab.
- Select Active, Suspended, Completed, or All, alerts in the drop-down menu to display a list of the selected alerts filter.
-
Select the + icon in the Action bar to create, or import, an alert. The Alert Editor window opens.
-
Provide the following fields:
- Alert Name: Provide a name for the alert, as this field is mandatory. The name must be unique per logged-in user, and it is case sensitive.
- Alert Description: Optionally, provide a description for the alert.
- Type: Select the email format (HTML/XLSX/CSV), which is a mandatory field. HTML is the default format for this field.
-
Target: Select the pen icon to select a dashboard (owned by, or shared with, the logged-in user) to be sent in this mandatory field. The dashboard list opens. When sending a target dashboard, Default/Mandatory Prompt filters, Applied filters, and dashboard default filter options will be considered.
-
Condition: Use the pen icon to create a condition table Insight (using a filter on that Insight) to be sent to the engine. The Analyzer opens. If the table gets returned from the engine containing data (rows), then the condition will be evaluated as true. Otherwise, it is considered false.
- Start By: Set the date, time, and time zone when the condition evaluation should start.
- Recurrence: Set the recurrence of evaluating the condition. This is a mandatory field.
-
Send To: Select the ”+” icon to add the alert recipients, which could be any combination of the Incorta users/groups and emails. Then, type the names, groups, or email addresses of the dashboard recipients. You can also select from the suggestions appearing as you type. Select Add, or Cancel.
- Select Done in the upper right-hand corner of the screen to finish creating the data alert.
- Select an alert from the Data Alerts list, the Alert Editor window appears.
-
Select one or more data alerts, and select the “Actions” drop-down menu in the upper right-hand corner to:
- Export the data alert(s).
- Delete the selection(s).
The Data Alerts feature is available to create and edit for users with the following roles:
- Analyze User.
- Individual Analyzer.
- SuperRole. (When the “Super User” mode is enabled, users with this role can view and edit other users’ alerts.)