Base Table
The “Base Table” feature allows you to join two tables that are not directly joined (i.e. tables that do not share common dimensions). To use it, a transactional table has to be selected as the “Base Table”, or driving table, in order to join the two tables.
Example:
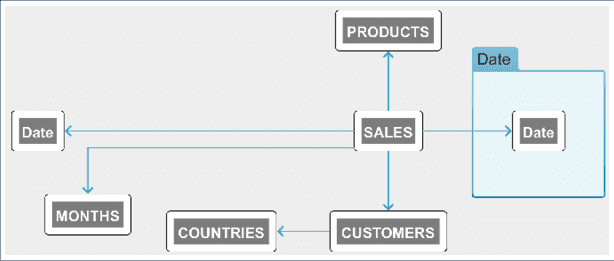
Consider a SALES table that is joined with a CUSTOMERS table, which is joined with a COUNTRY table. Now assume that there is a PRODUCT table and it is joined with the SALES table, but not to the COUNTRY table. If you try to build a report showing the countries where the products were sold, you will get an error because the COUNTRY table is not directly joined to the PRODUCTS table. However, if you use the transactional table (SALES in this case) as the Base Table, this information can easily be obtained. Refer to the ER diagram below for clarification, and walk through the following steps to learn more about this feature:
Assumptions:
You have a schema where there is a transactions table (SALES table in this example), and it is joined with a CUSTOMERS table that is joined with a COUNTRY table. The SALES table should also be directly joined with the PRODUCTS table. (In this example, the COUNTRY table is not directly joined with the PRODUCTS table.)
Build a “Table” Insight containing the countries versus the products
- From a new, or any, dashboard page, select the “+” in the upper right-hand corner of the screen to add a new component (Insight) to the dashboard.
- When the “Choose a Visualization” window appears, select the Table chart from the TABLES list. The Insight opens in Analyzer mode.
- Select the “+” next to the search box at the top of the source elements list, on the left-hand side of the screen. The schemas and tables submenu opens to the right-hand side.
- Select “Tables” in the drop-down menu at the top of the submenu. A list of schemas and included tables appears.
-
Select the “SALES” schema, or the “COUNTRY” and “PRODUCTS” tables individually from the “SALES” schema. Notice the schema/tables being added to the list on the left-hand side.
- Select Done at the bottom of the submenu on the right-hand side, to close it. To see the number of products sold in each country, drag the “Product” column to the measure field and drag the “Country” column to the grouping dimension field.
-
Type “Country” in the search box to quickly locate it and drag it into the list to the “grouping dimension” field. Another option is to hover over “Country” in the search results and select the ”+” that appears. The item will automatically get placed in the “grouping dimension” field, if the circle next to the item is light-blue. If the circle is dark blue, it will pop in the “measure” field. In any case, you can move any column from one field to the other.
- Similarly, type “Product” in the Search box and place it in the “measure” field. The Base Table feature can only be turned on for the elements in the “measure” field (i.e. Product in this example).
-
Enable “Aggregation” in the Insight Settings menu in the upper right-hand corner of the screen.
-
Ensure only distinct data is returned, by clicking on the down arrow corresponding to the “Product” element. The dimension menu appears.
-
Change “COUNT” TO “DISTINCT” in the “Aggregation” field of the measure drop-down menu.
-
Select the “Advanced” tab, to set the base table for this measure.
-
Enable the “Base Table” feature. A new field “Base Table” appears to set the base table.
-
Select Set Base Table Field to locate the base table (“SALES” in this example). That is, the common table “Product”. First, locate the schema where the table is located (the schema name is also “SALES” in this example).
-
Select the “SALES” schema from the schemas list. A list of the tables within the “SALES” schema appears.
-
Select the “SALES” table from the tables list. A new list of all the table columns appears.
-
Select any column. The base table Insight is now ready and updated with the number of products in each country. The Sales table is selected as the Base Table since it is joined with both; the Country and Product tables. (Again, the Country table is not directly joined with the Product table.)
-
To build an Insight Table showing the number of countries where each product is sold, repeat the previous steps, swapping “Product” with “Country”.
- Notice the table is updated, listing each product corresponding to the number of countries where it was sold.
